
ServerPulse
Effortless Minecraft performance monitoring with pre-configured Grafana/InfluxDB via Docker.
截图

介绍

ServerPulse is your all-in-one server monitoring solution that combines powerful metrics collection, beautiful visualizations, real-time alerting, and effortless setup. Monitor TPS, memory, entities, and more through professional Grafana dashboards – all up and running in minutes with Docker!
Tired of guessing why your server is lagging? Frustrated with complex monitoring setups? ServerPulse is what you are looking for!
If you need support, or you have any question, join our Discord server
Why ServerPulse?
- Zero-Configuration Monitoring: Get started in minutes with our Docker Compose setup – InfluxDB, Grafana, and pre-built dashboards, all ready to go!
- Universal Platform Support: Works with any Bukkit-based, Velocity, BungeeCord and Fabric server while taking advantage of Paper-specific optimizations when available
- Complete Solution: Not just a metrics exporter – includes the entire monitoring stack optimized for time-series data
- Per-World Performance Tracking: Uniquely monitor metrics separately for each world – find problem areas fast!
- Advanced Tagging System: Group and filter metrics by server, network, region, or any custom dimension
- Production-Ready Infrastructure: Built-in health checks, automatic reconnection, and proper error handling
Real-Time Metrics Include:
- TPS (1m, 5m, 15m)
- MSPT (last, min, max, 1m, 5m, 15m)
- CPU Usage (System, JVM, Available Processors)
- Online Players
- Player Ping Statistics (min, max, avg)
- JVM Memory (Used, Committed, Max Heap)
- Disk Usage (Usable Bytes & Percent)
- Per-World Stats:
- Loaded Chunks
- Total Entities
Alert Notification System:
- Multi-Platform Support: Choose between Discord or Telegram for notifications
- Instant Notifications: Get alerted when TPS drops, memory spikes, or other critical events occur
- Customizable Thresholds: Set your own alert conditions for any metric
- Intelligent Alert Grouping: Prevents notification spam during ongoing issues
- Easy Integration: Simple webhook setup for Discord or bot configuration for Telegram
Technical Features:
- Efficient & Safe: Asynchronous tasks and batch writing minimize performance impact
- Platform Detection: Automatically detects your server type and uses the optimal implementation
- Flexible Configuration: Customize metrics collection intervals, alerts, and tagging
- Professional Dashboards: Start monitoring immediately with pre-designed Grafana dashboards
- Open Source: Full transparency and community-driven development
Requirements:
- Server: Any Bukkit-based, Velocity, BungeeCord or Fabric server (Bukkit, Spigot, Paper, or forks like Purpur, Pufferfish)
- System: Docker and Docker Compose for the monitoring stack
- Optional: Discord server or Telegram bot for alert notifications
Quick Start:
Clone, compose up, and you’re monitoring! Full setup guide at https://github.com/renvins/serverpulse
Screenshots:
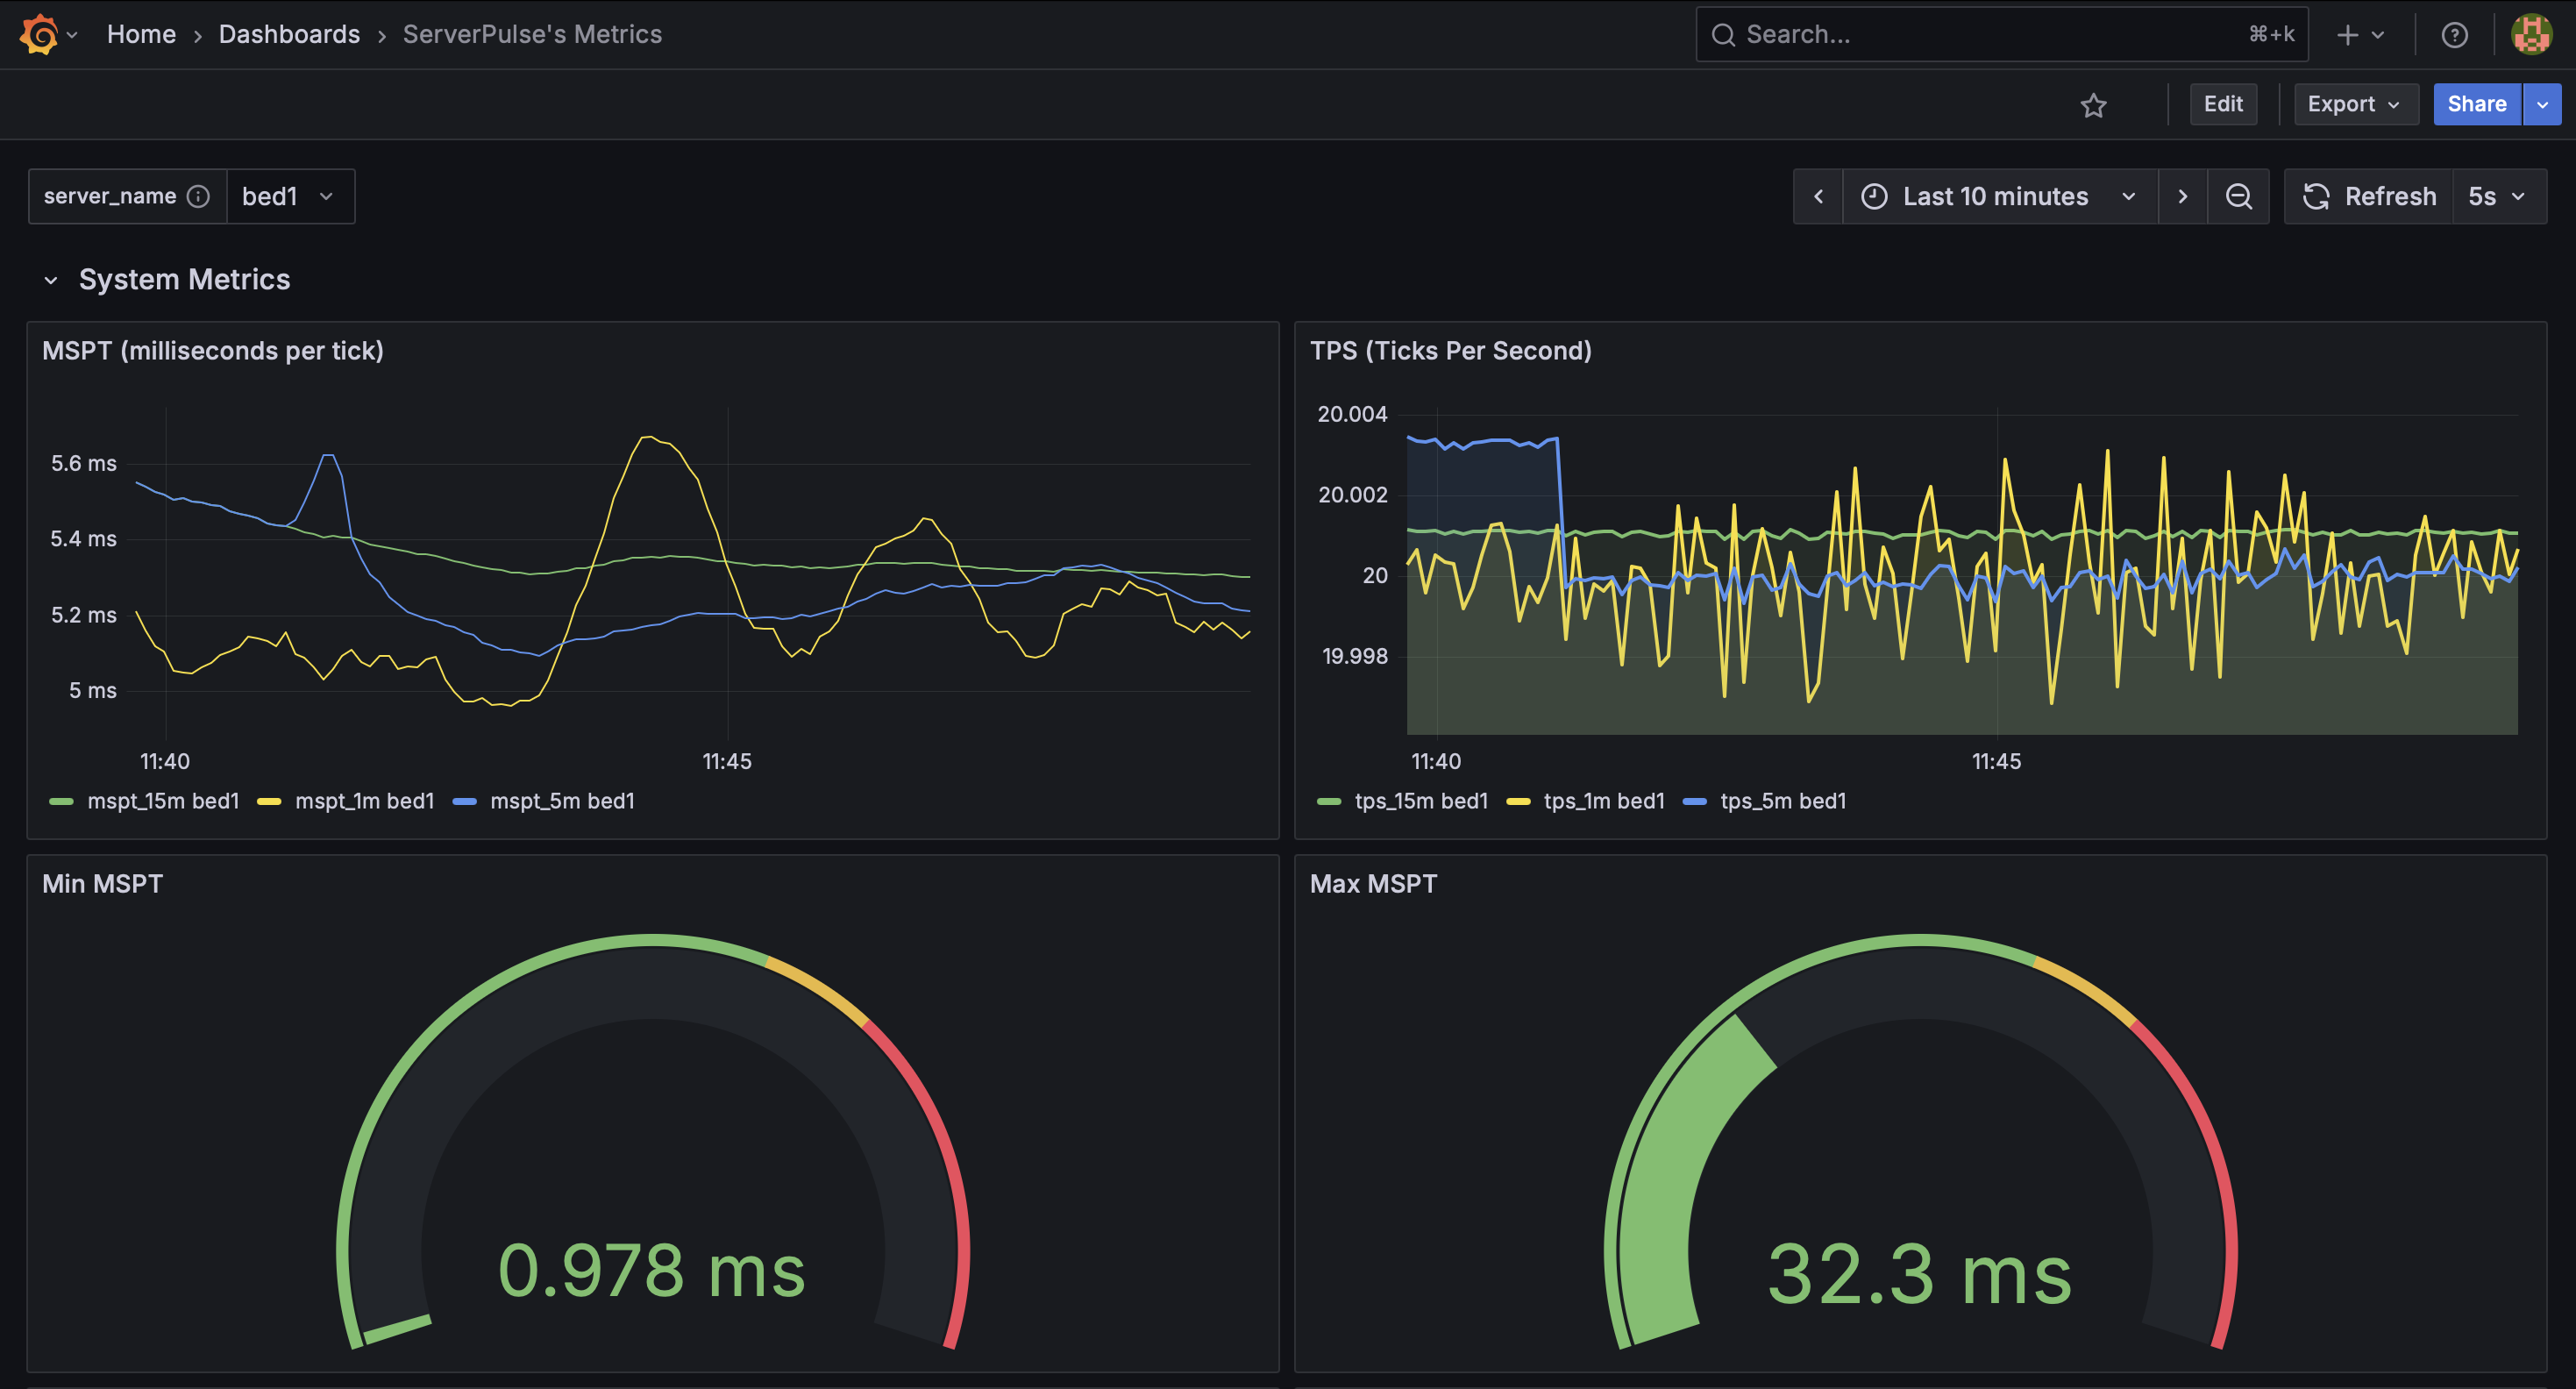
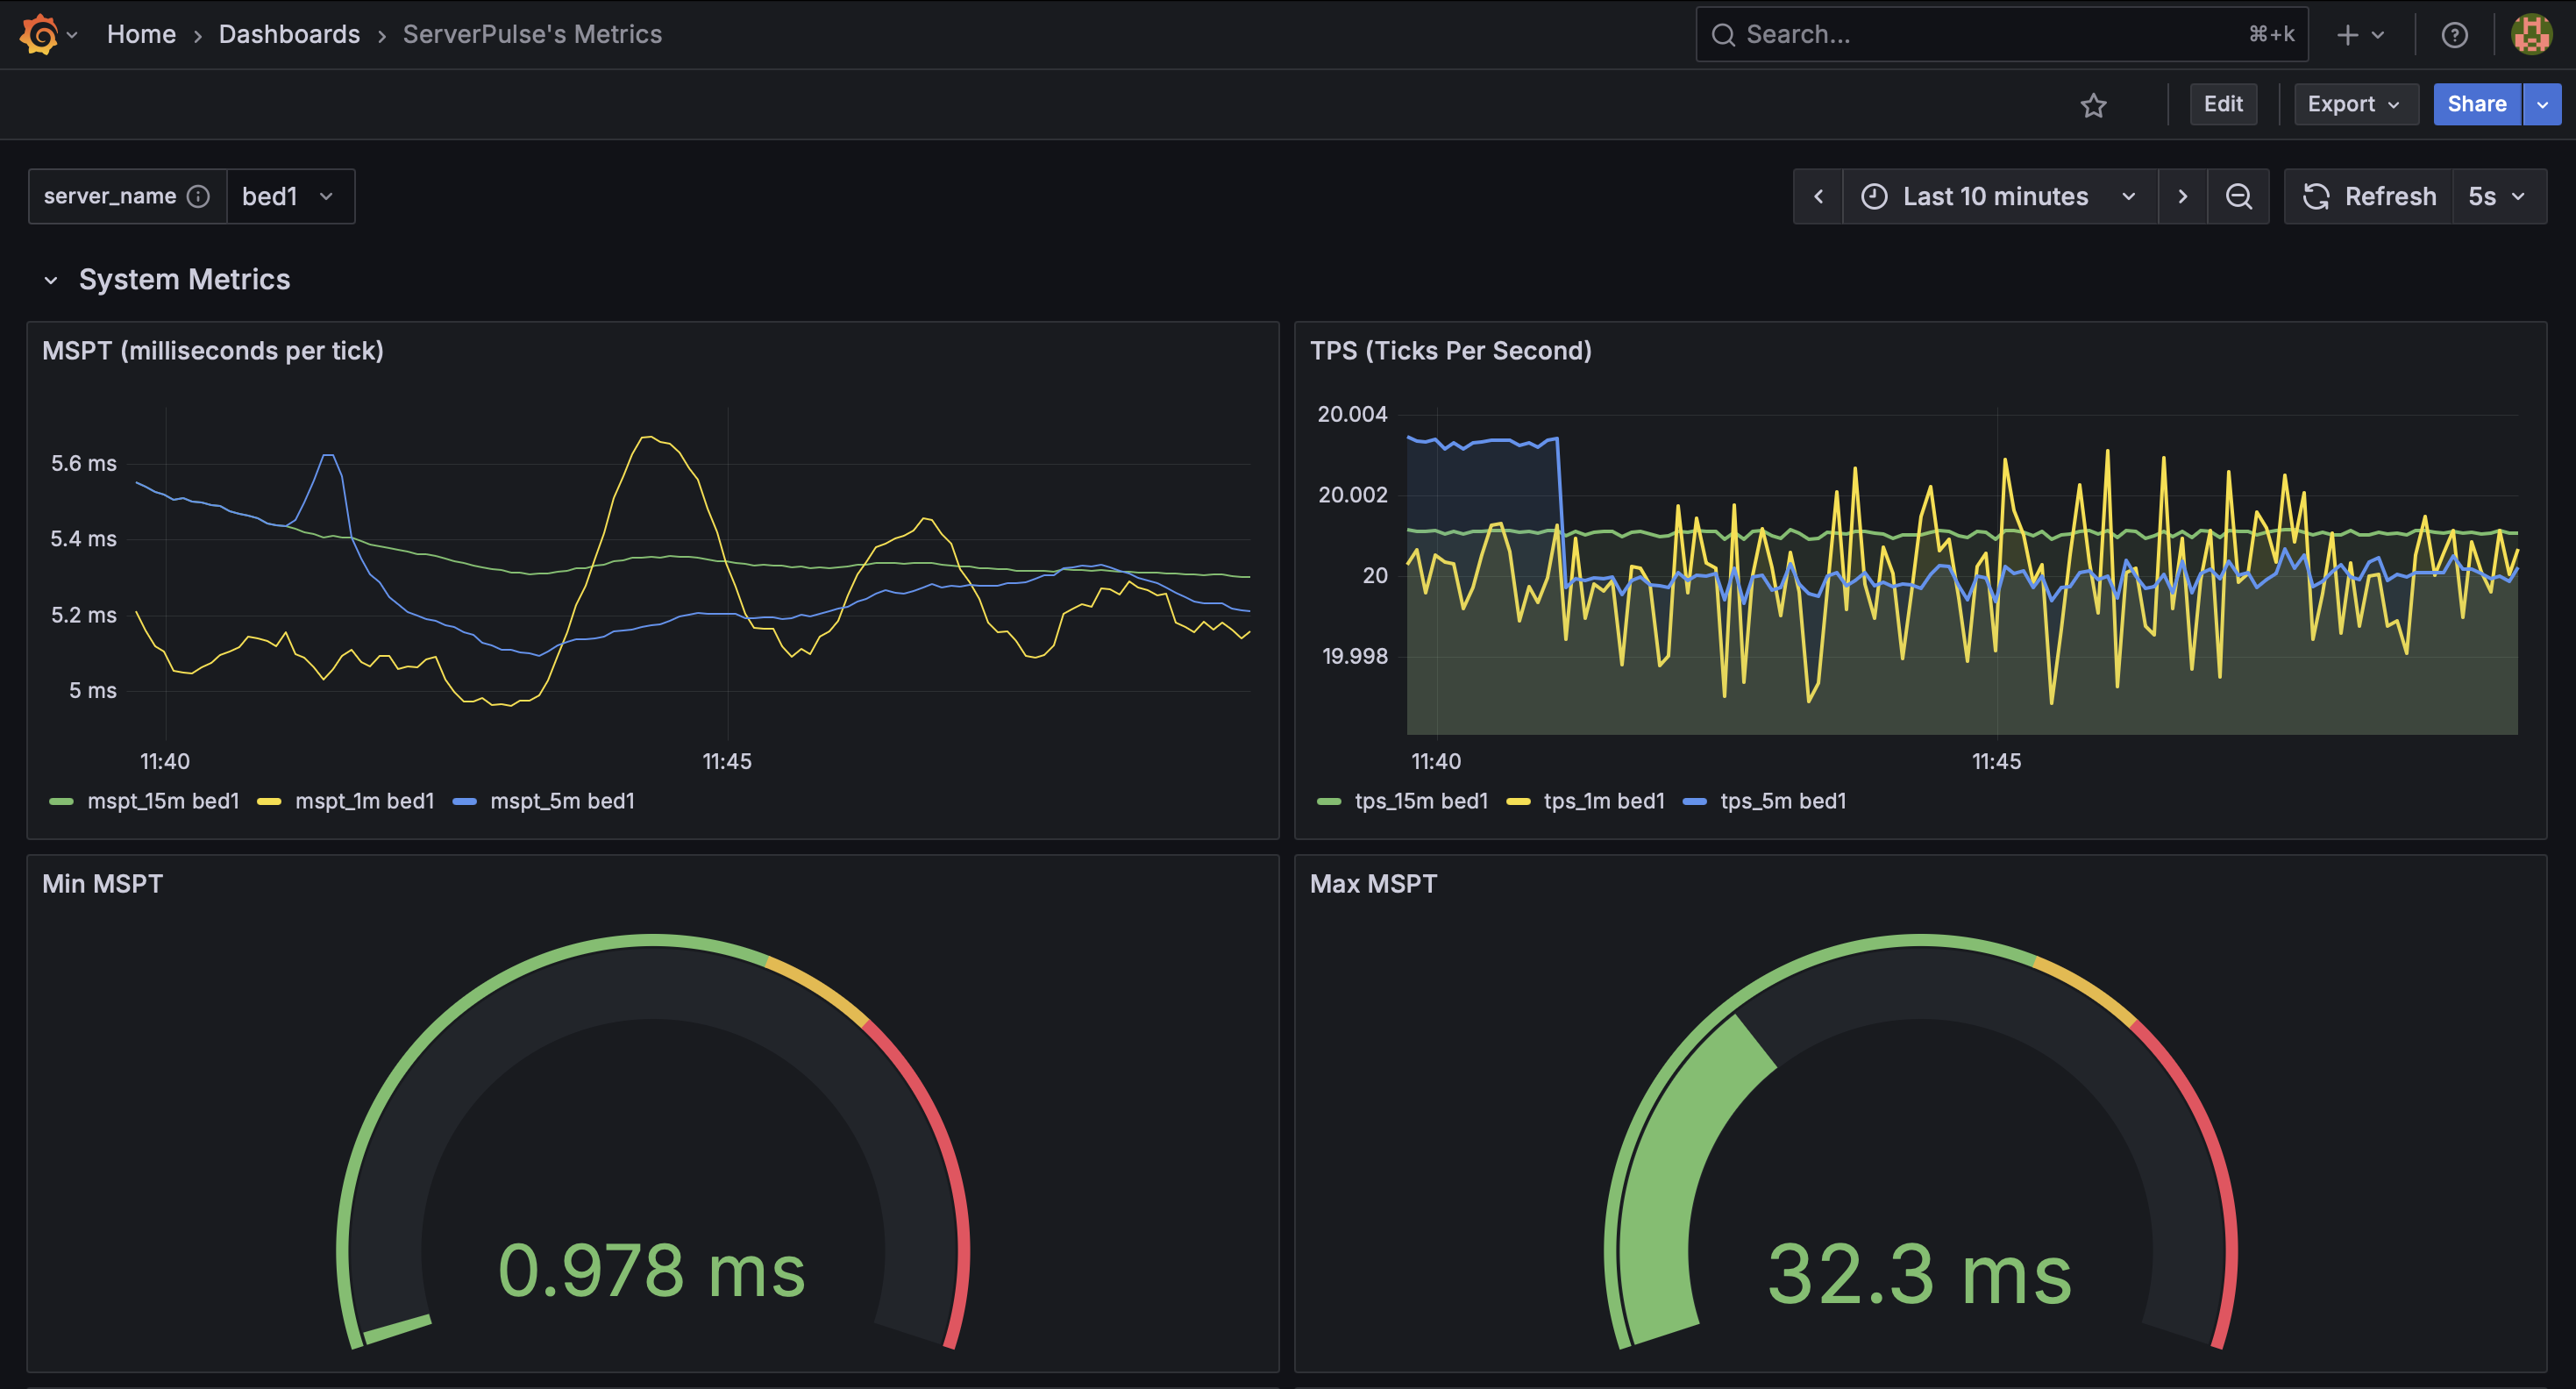
_Example dashboard view 1: System Metrics_
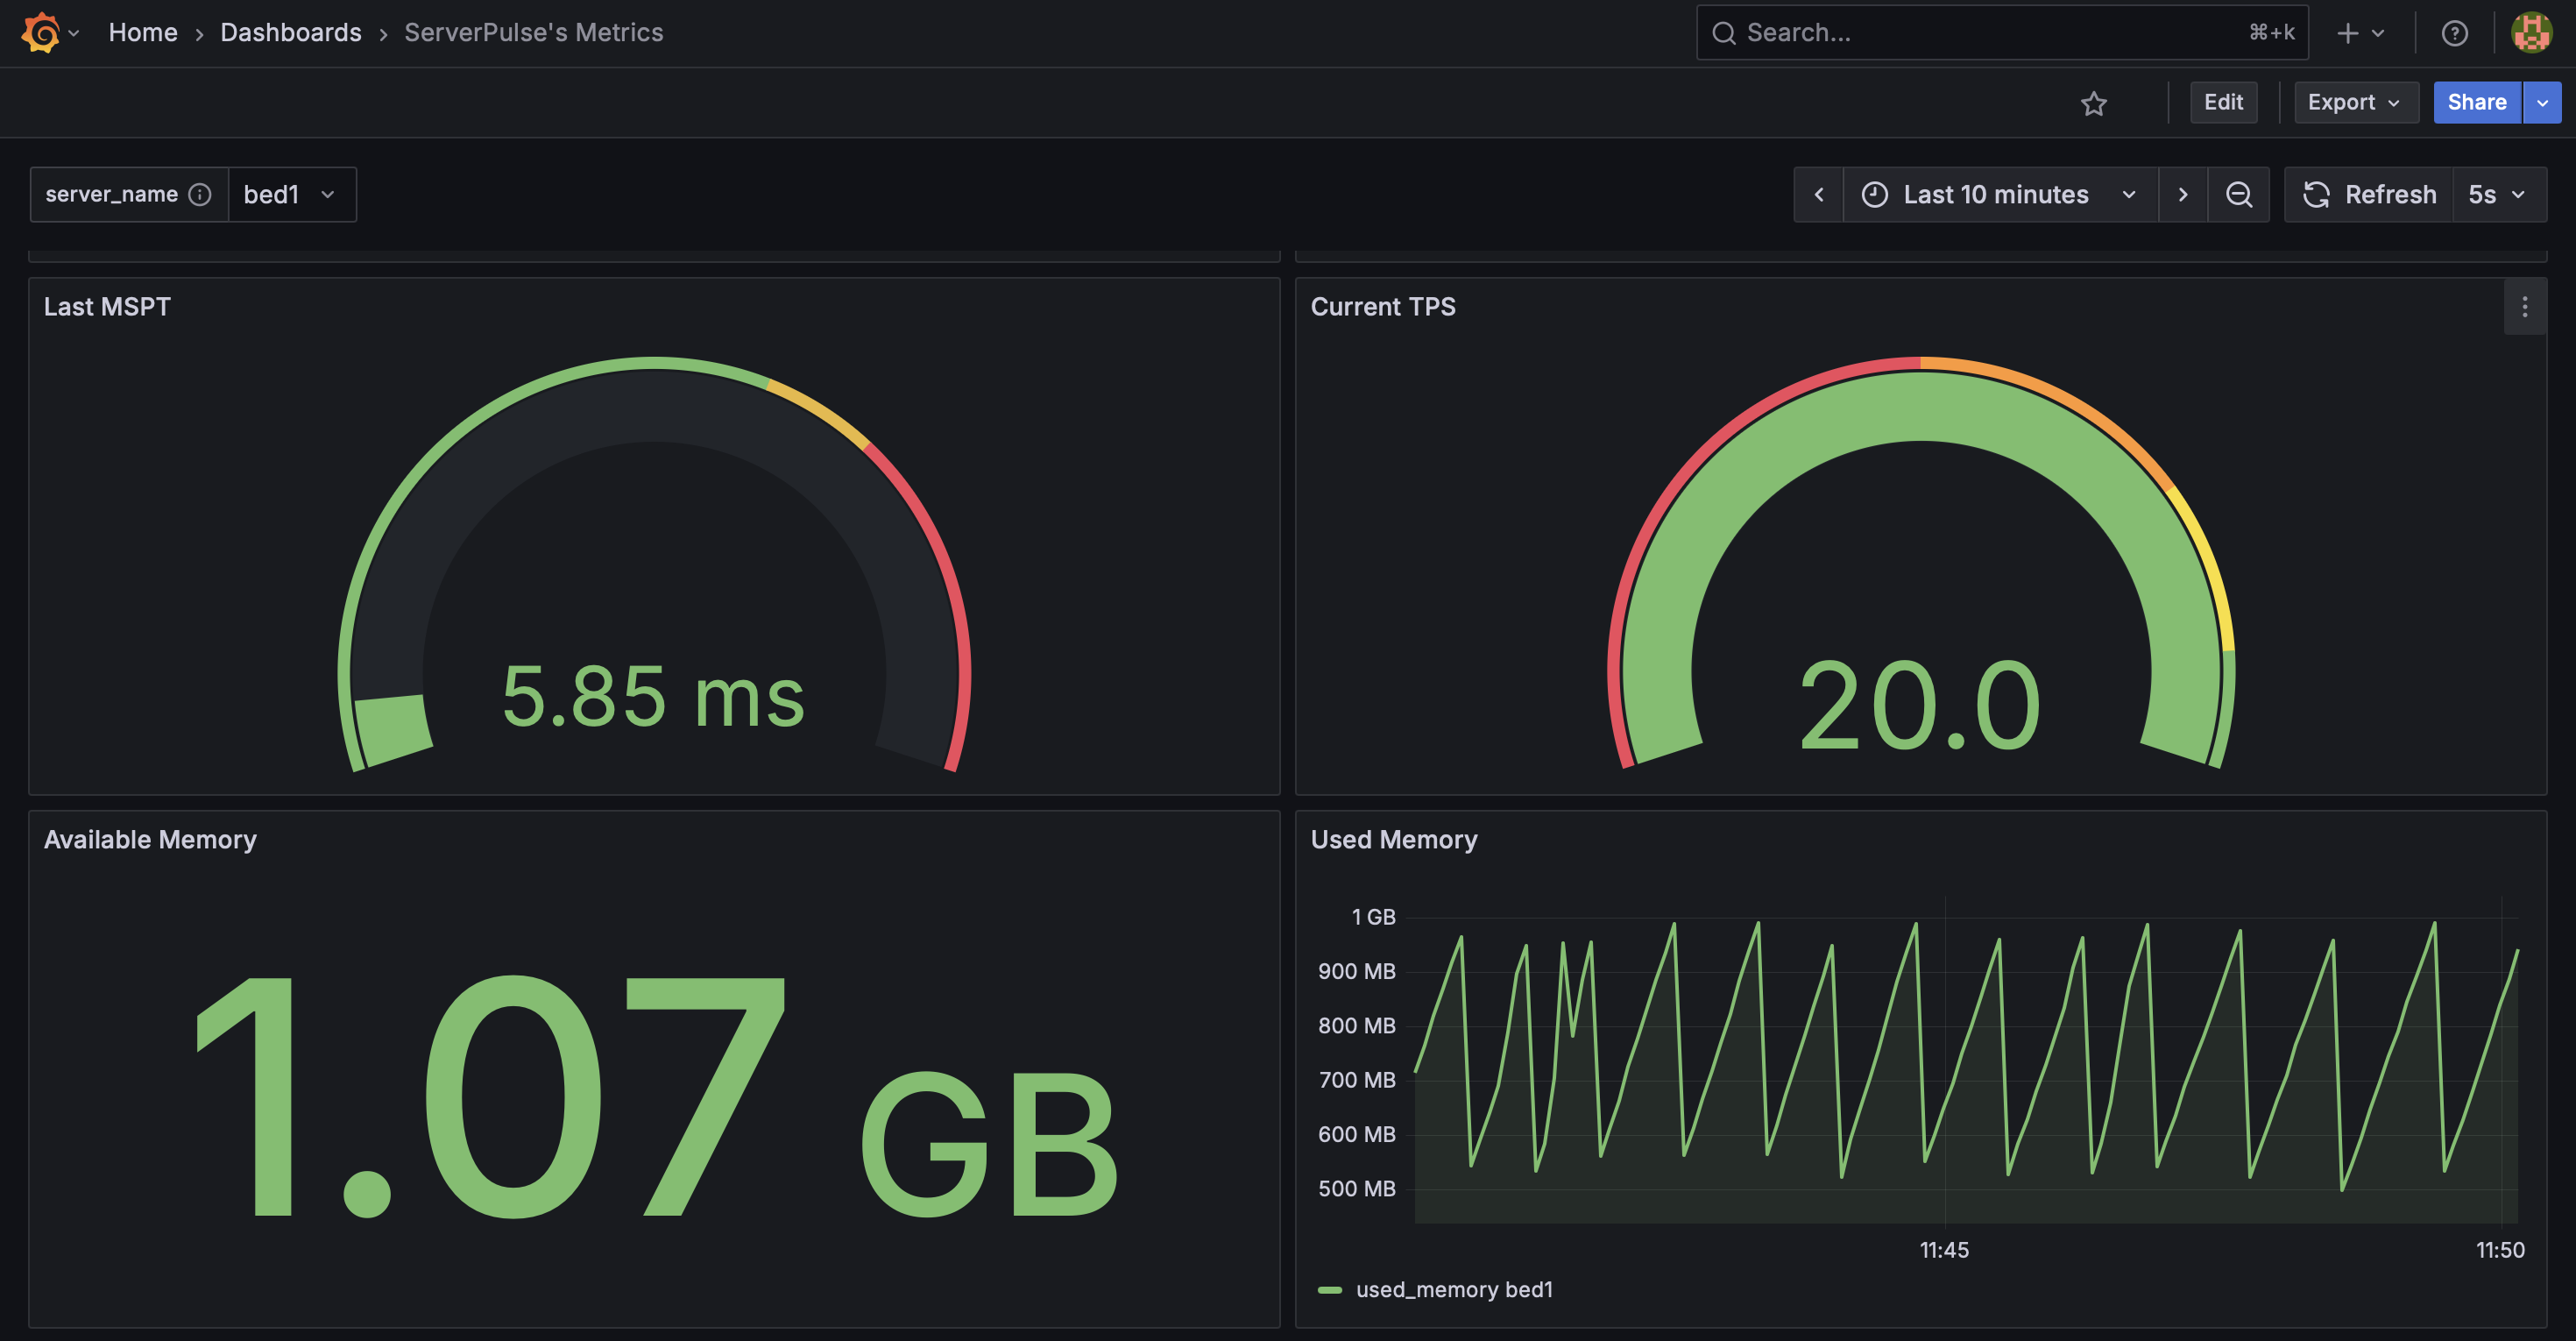
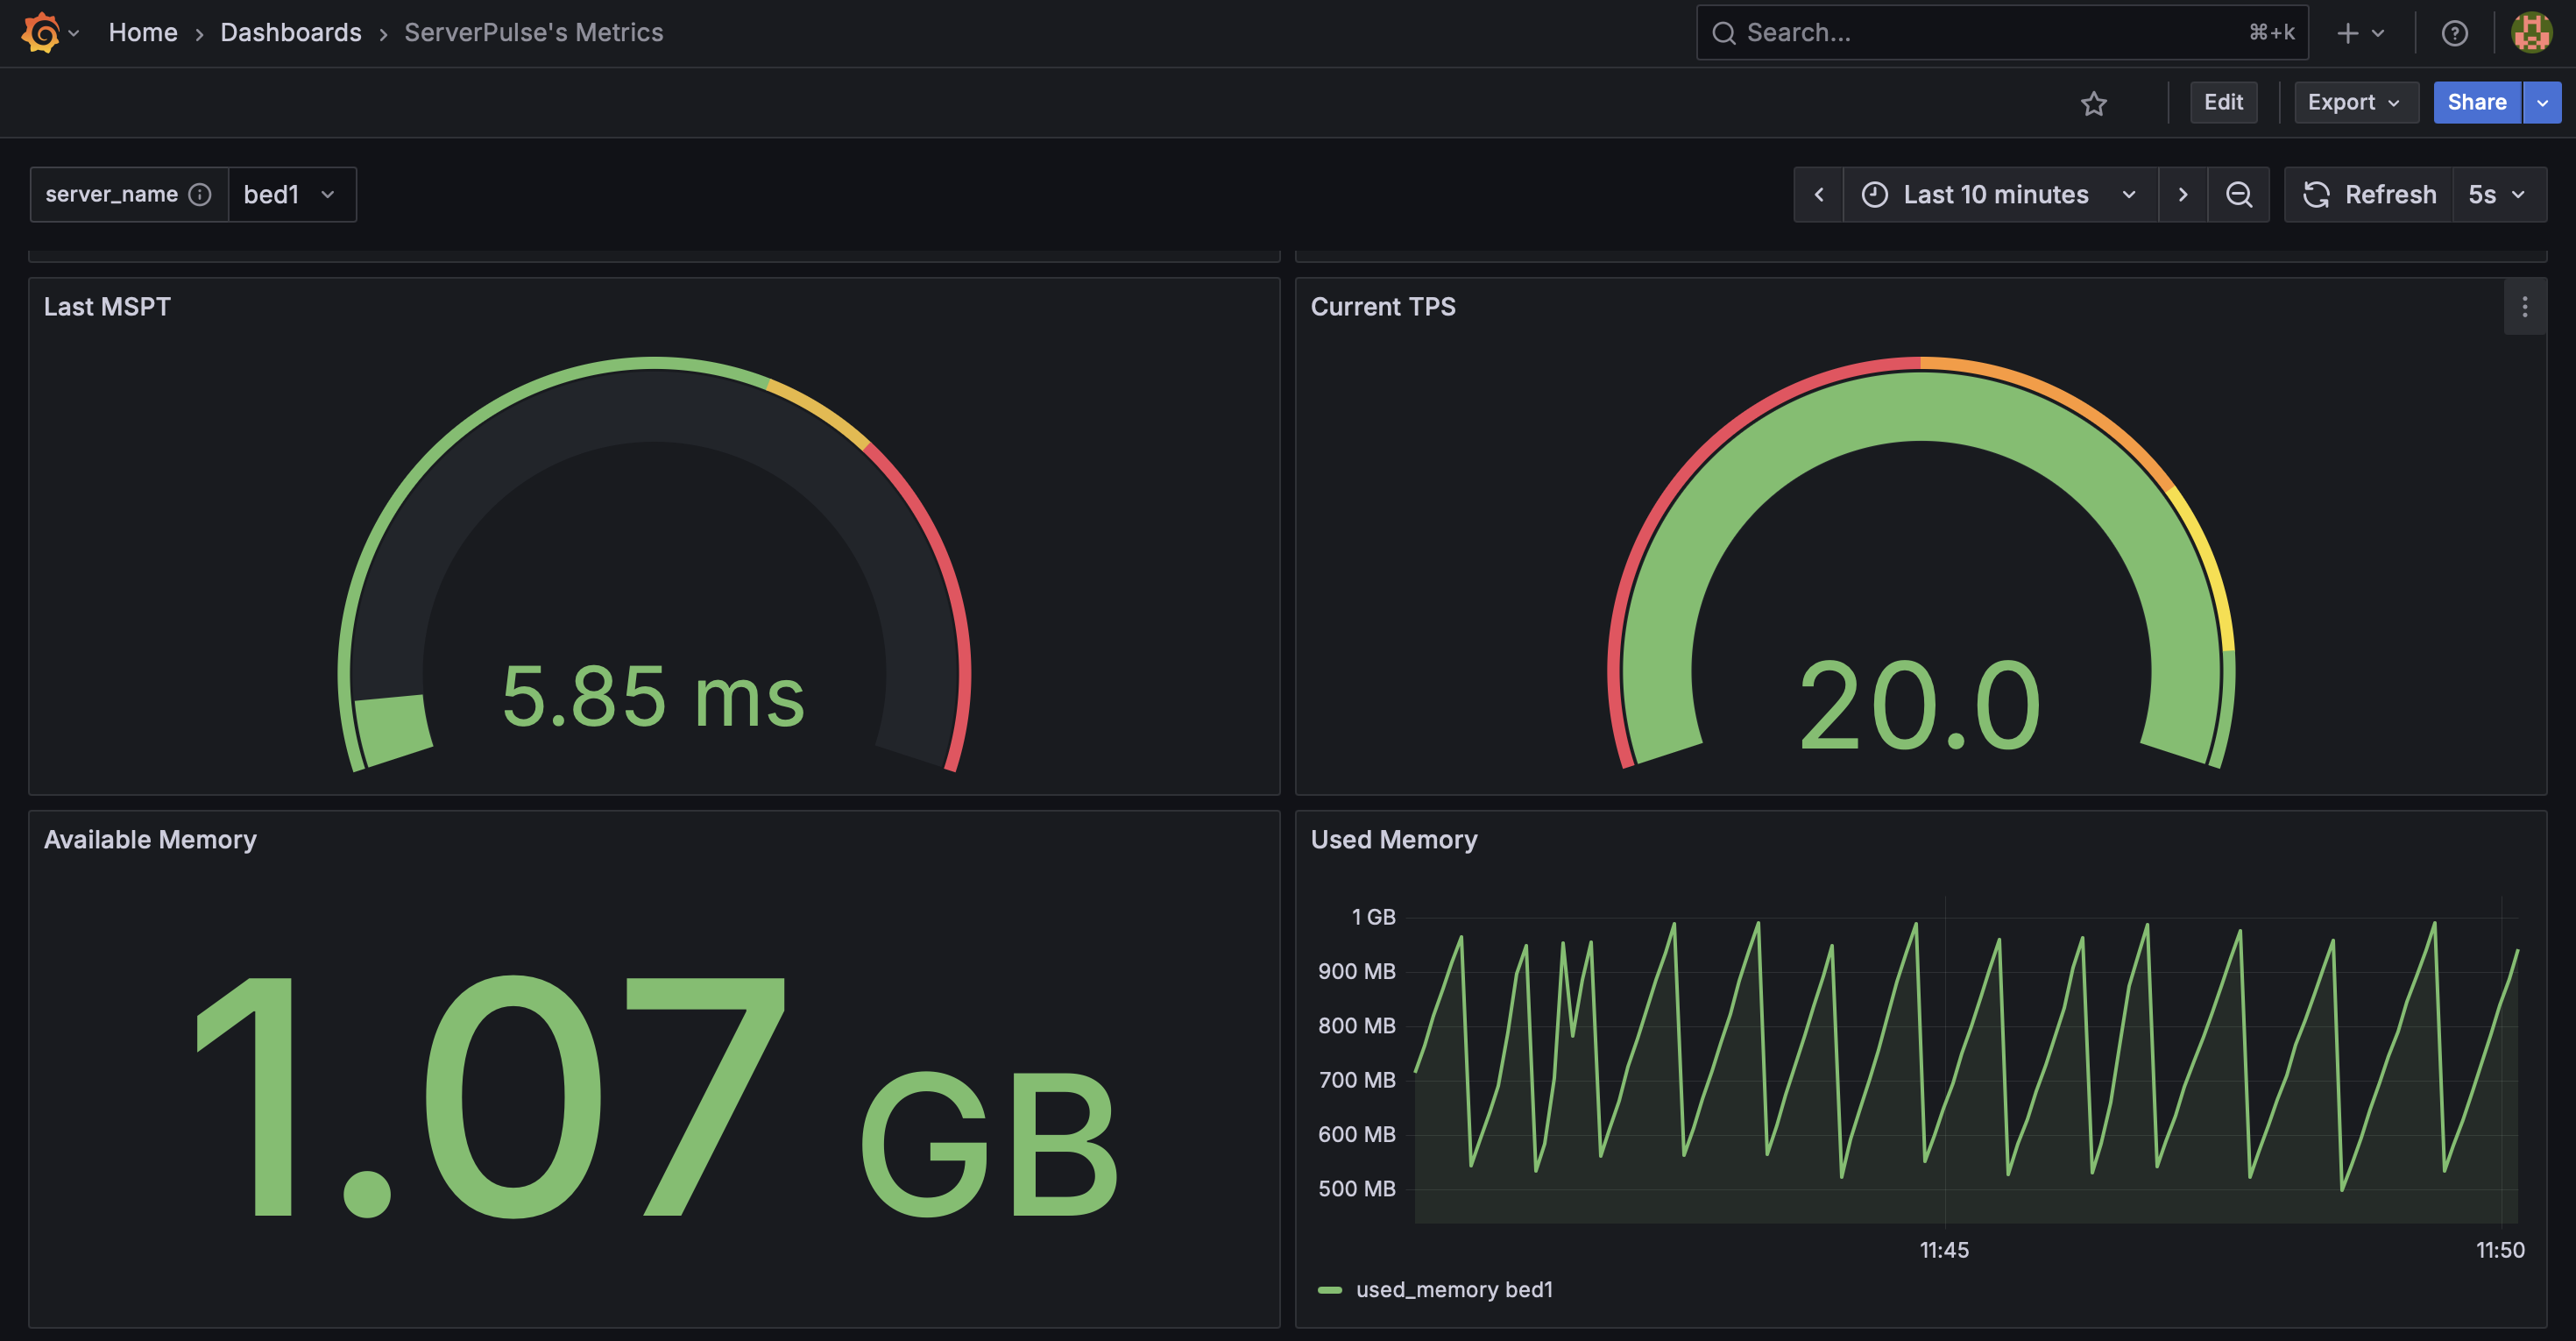
_Example dashboard view 2: System Metrics 2_
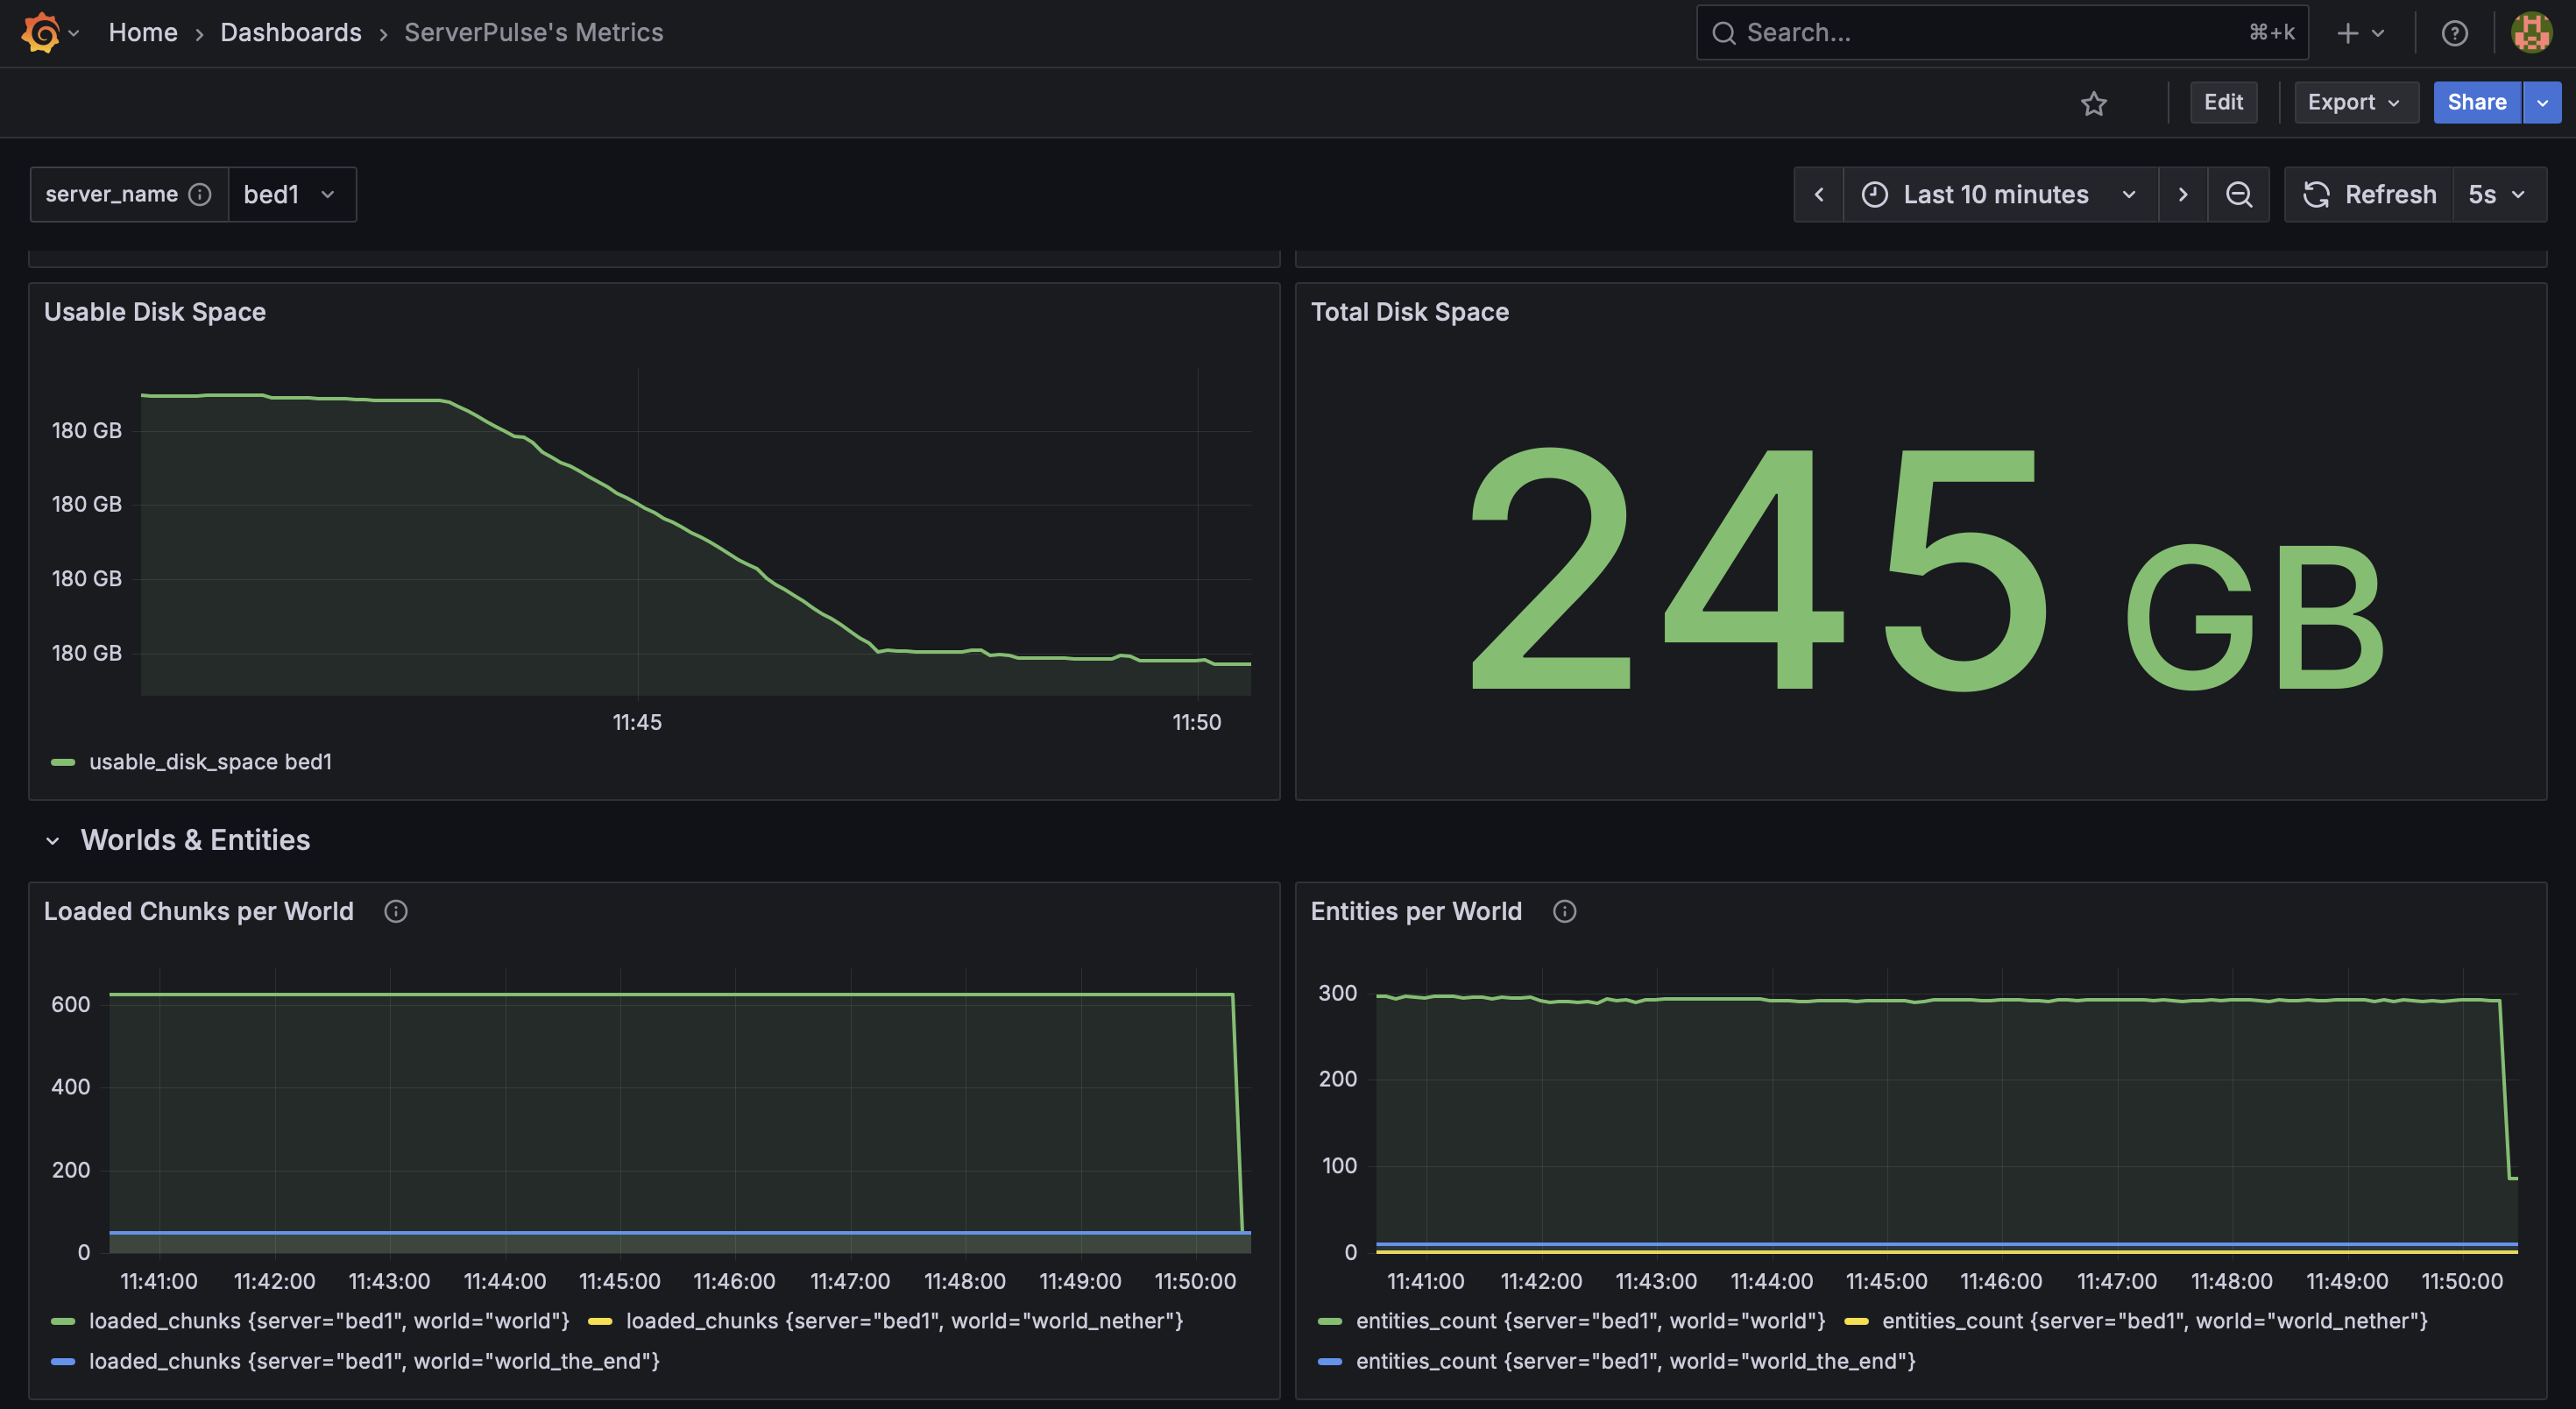
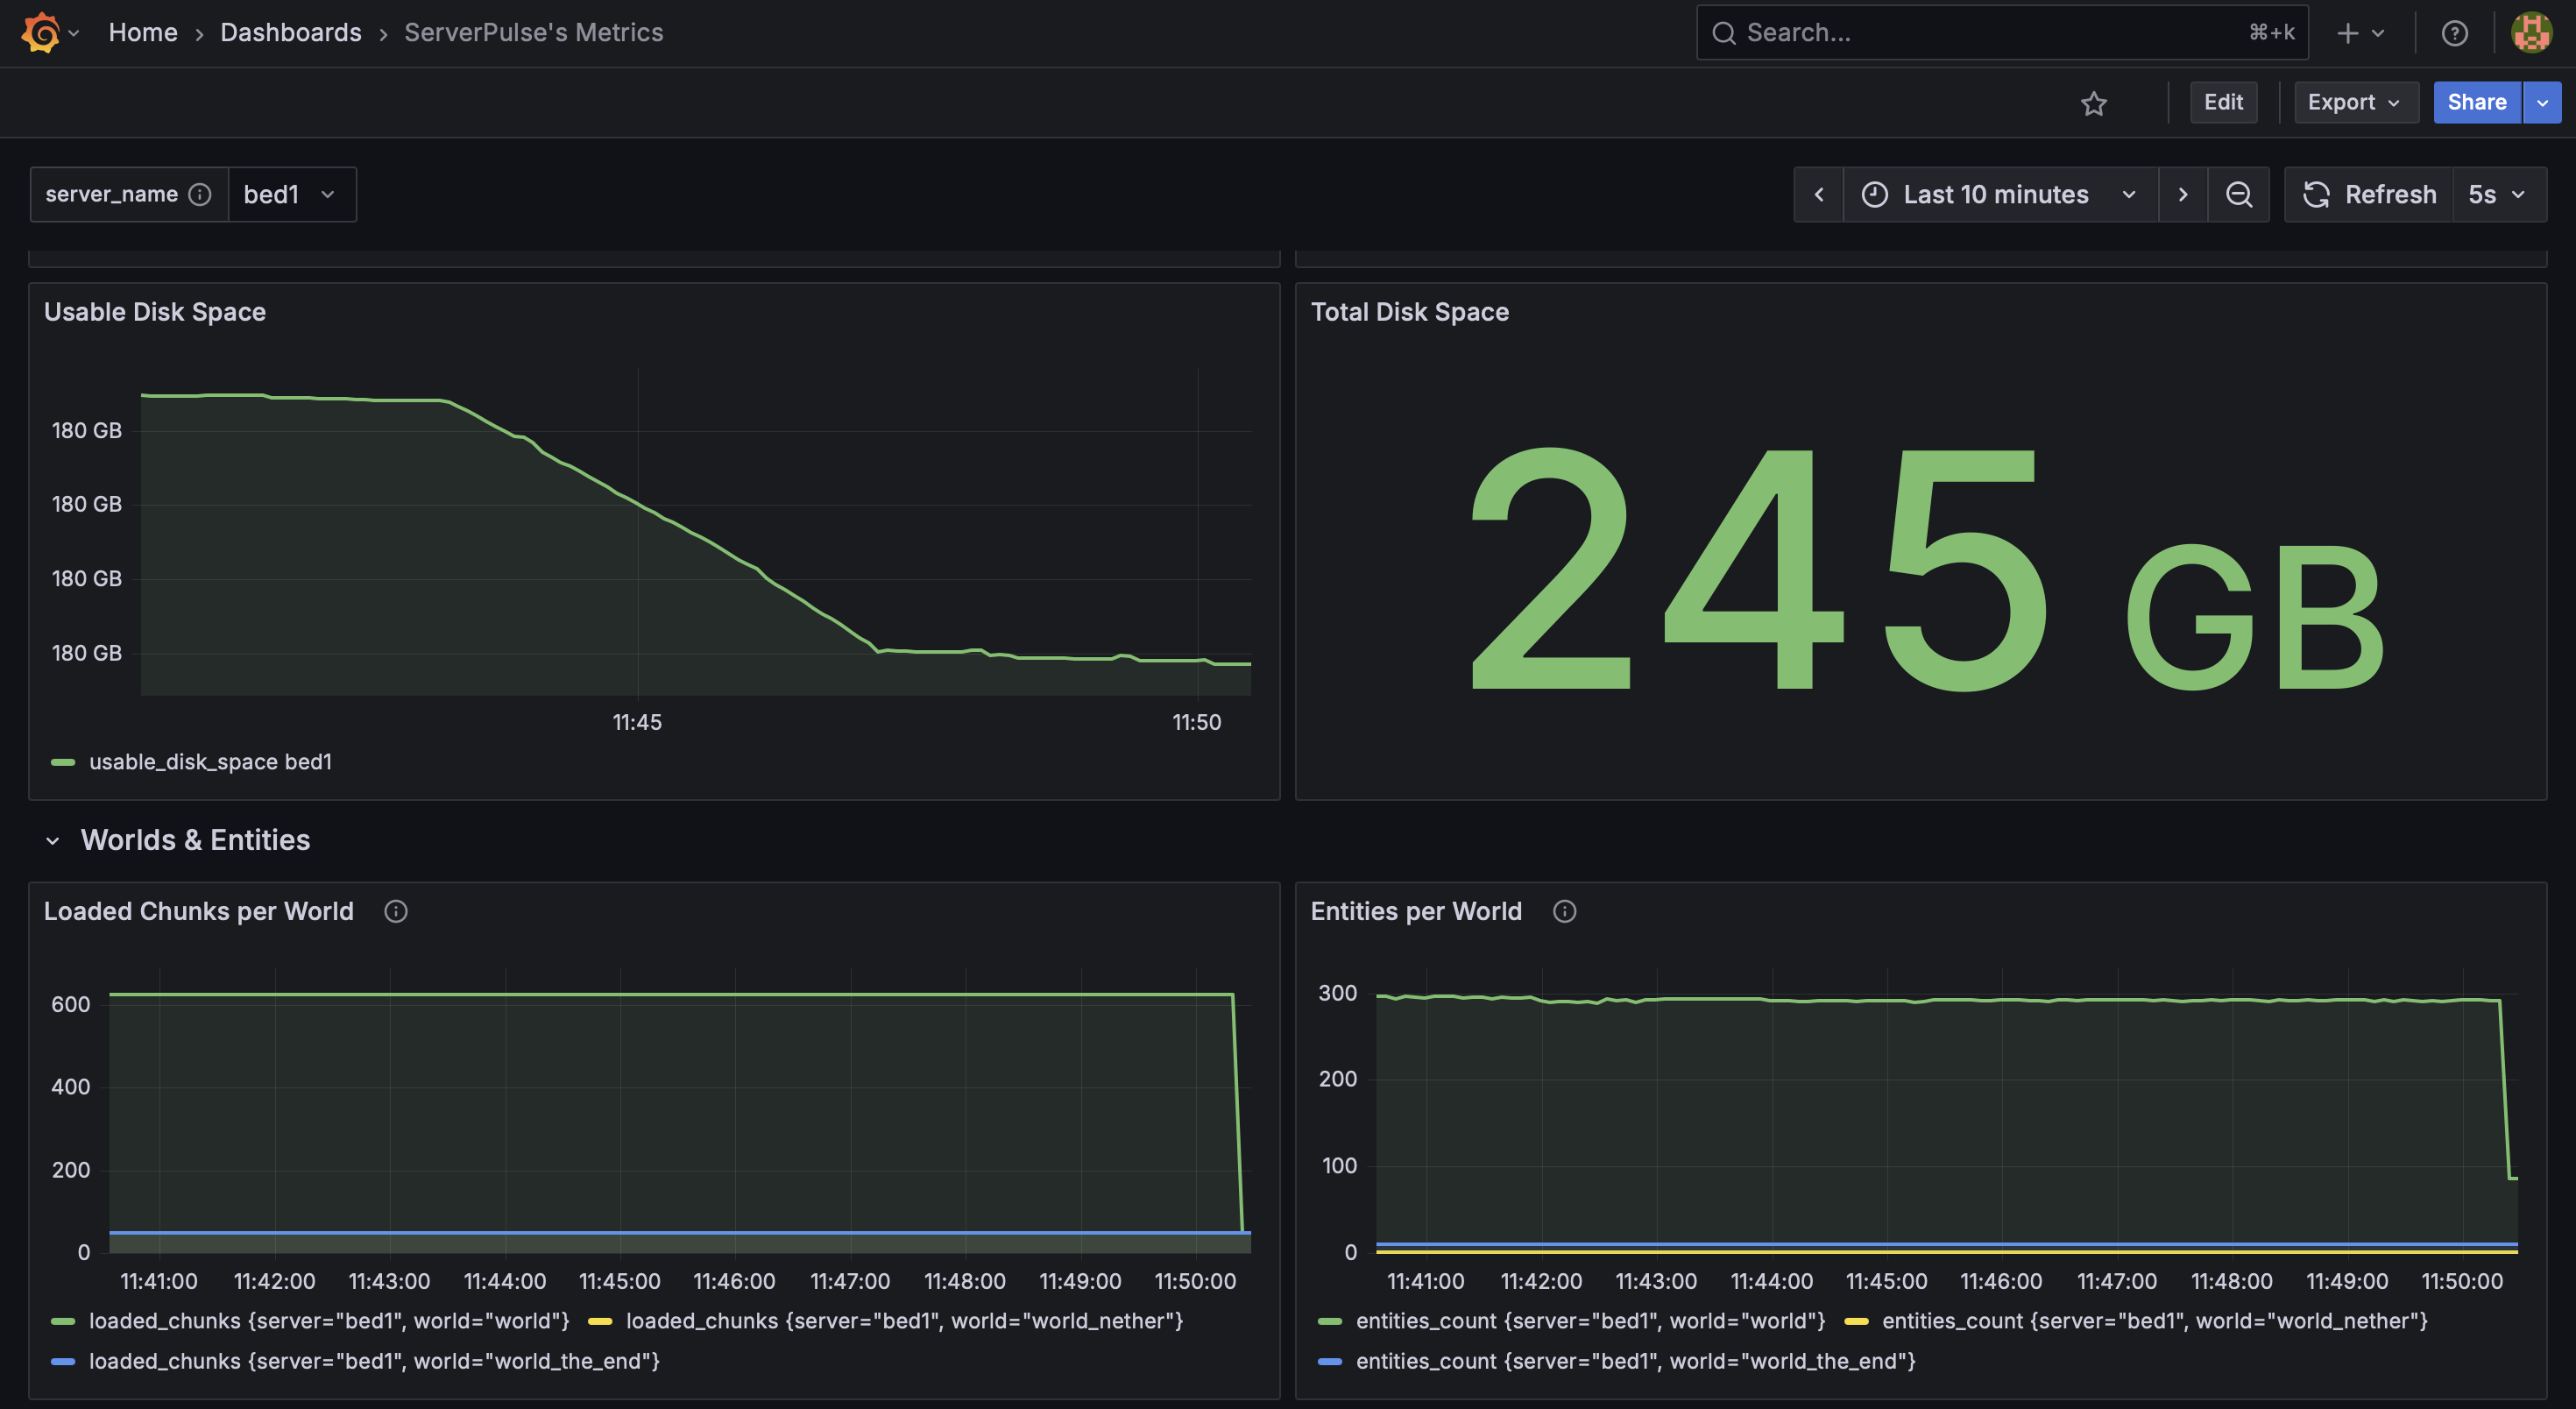
_Example dashboard view 3: System & World Metrics_
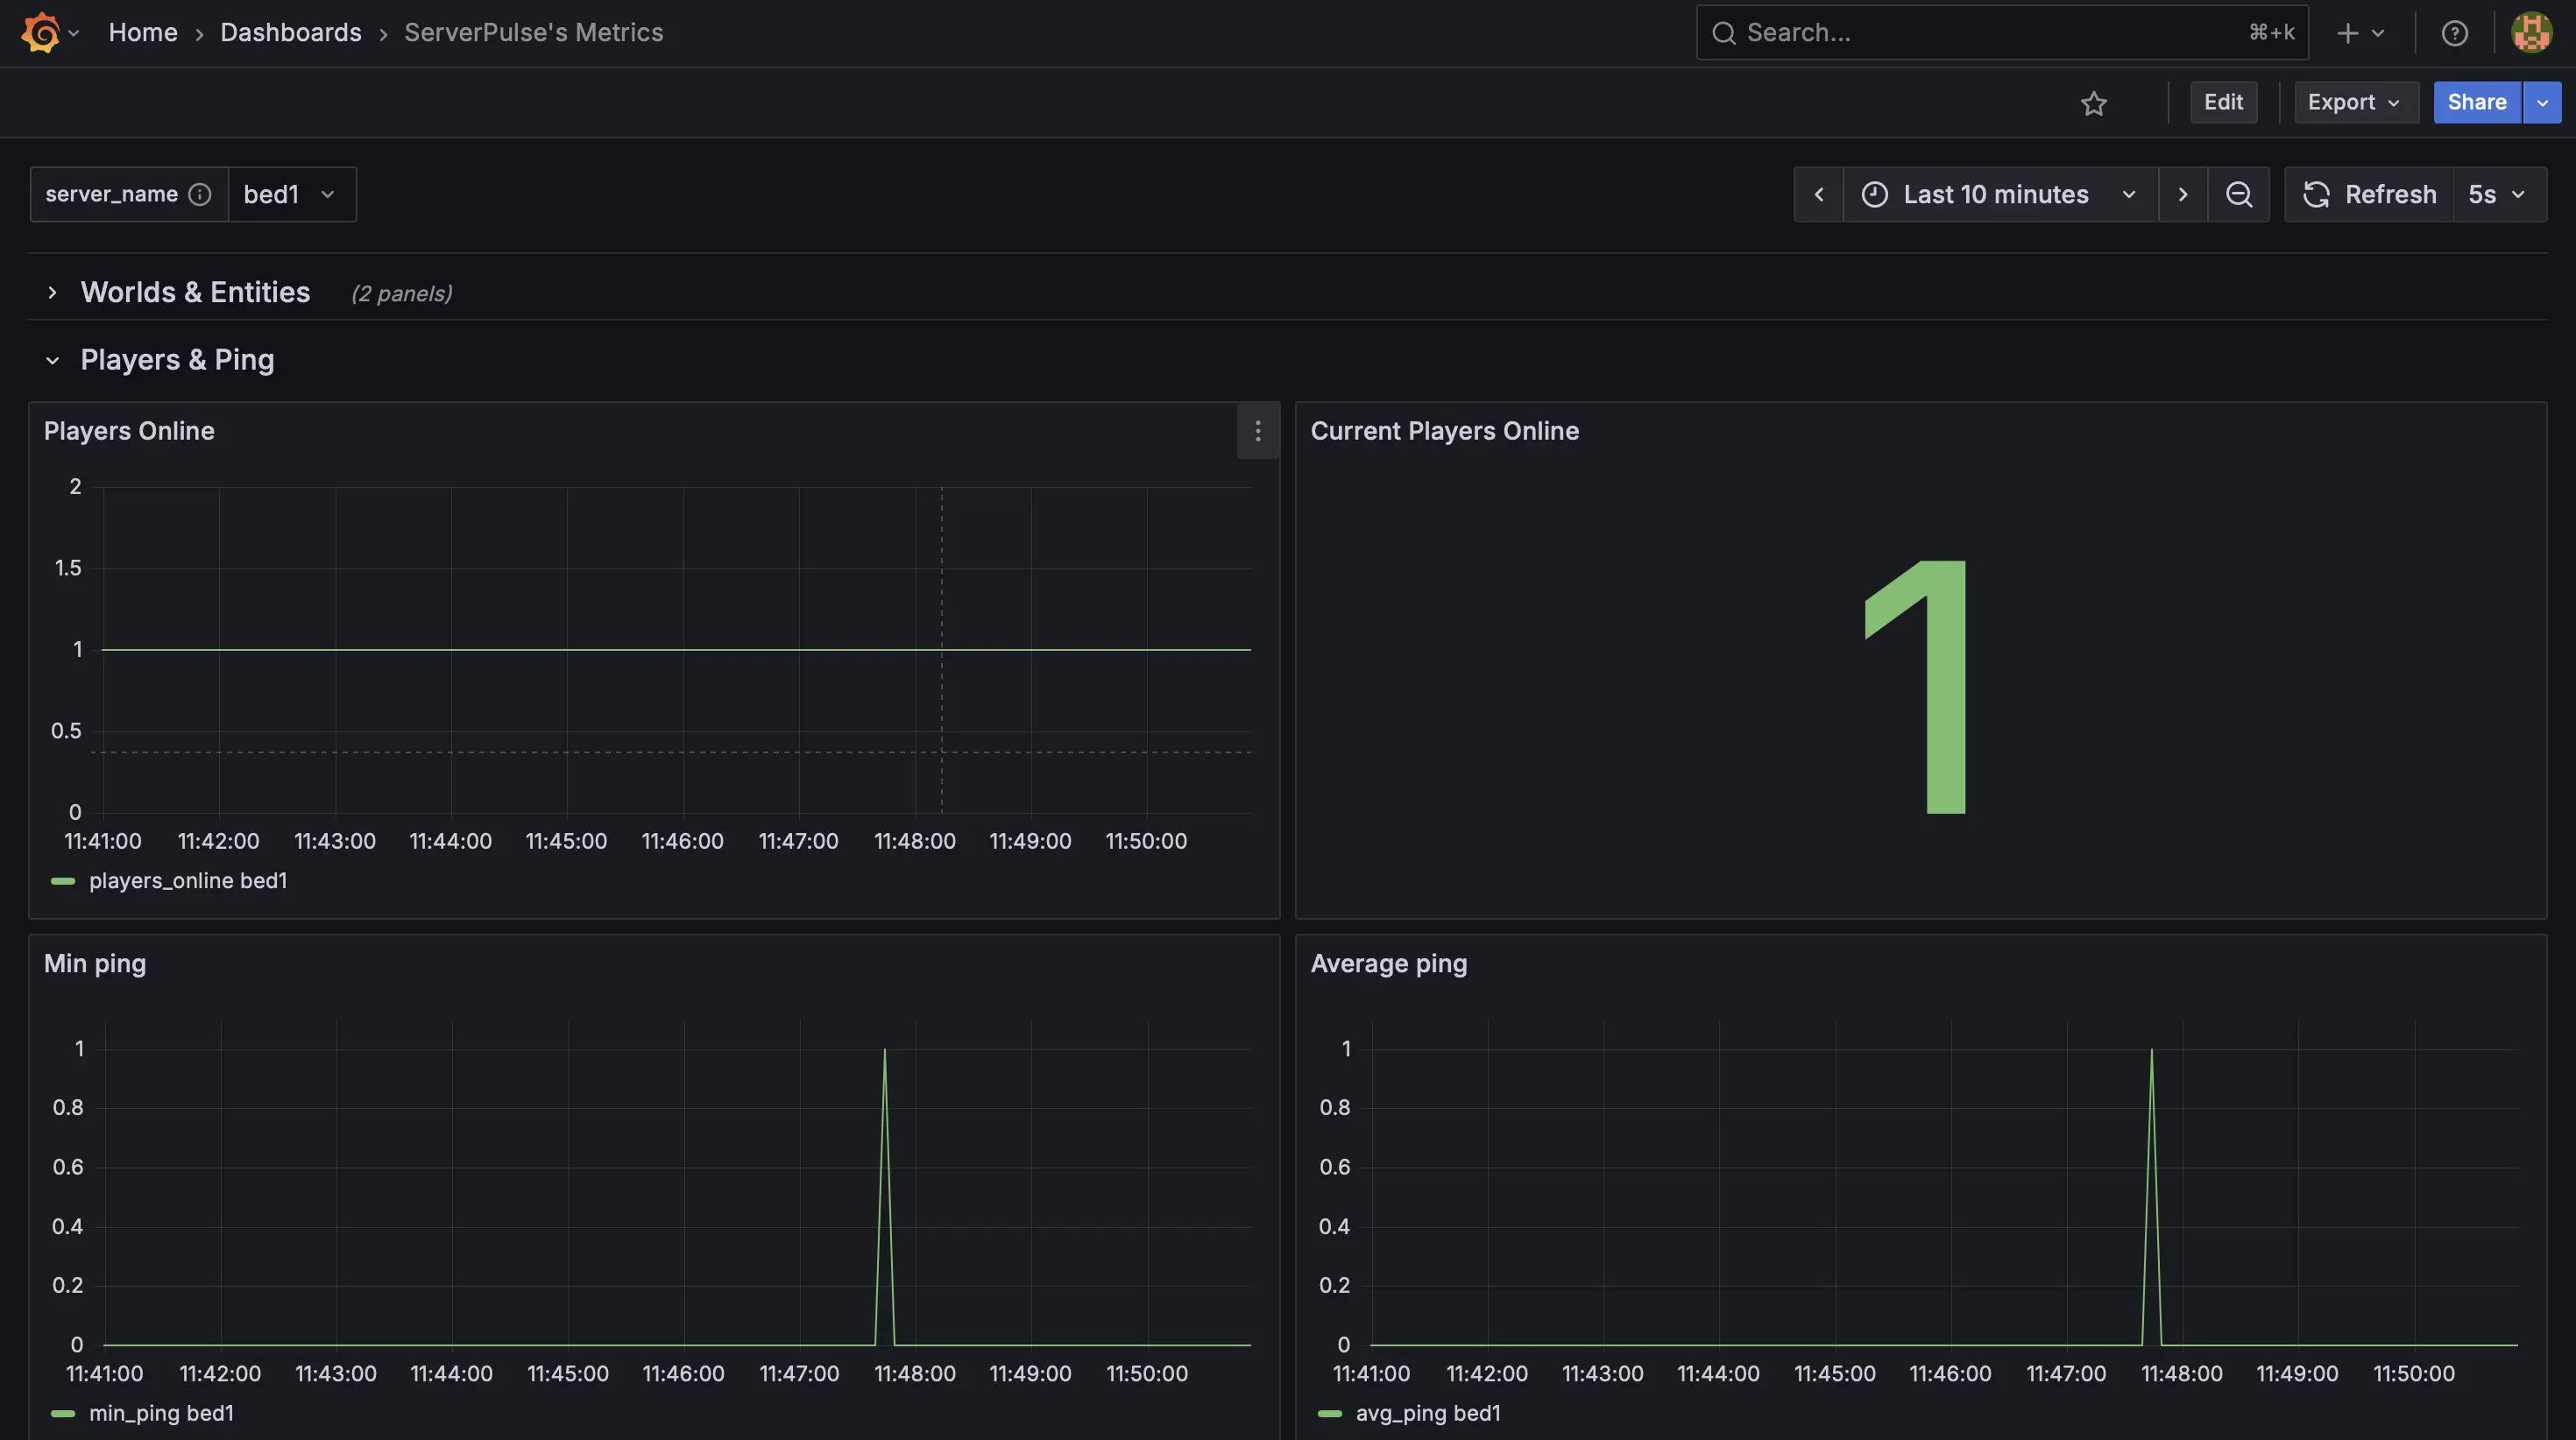
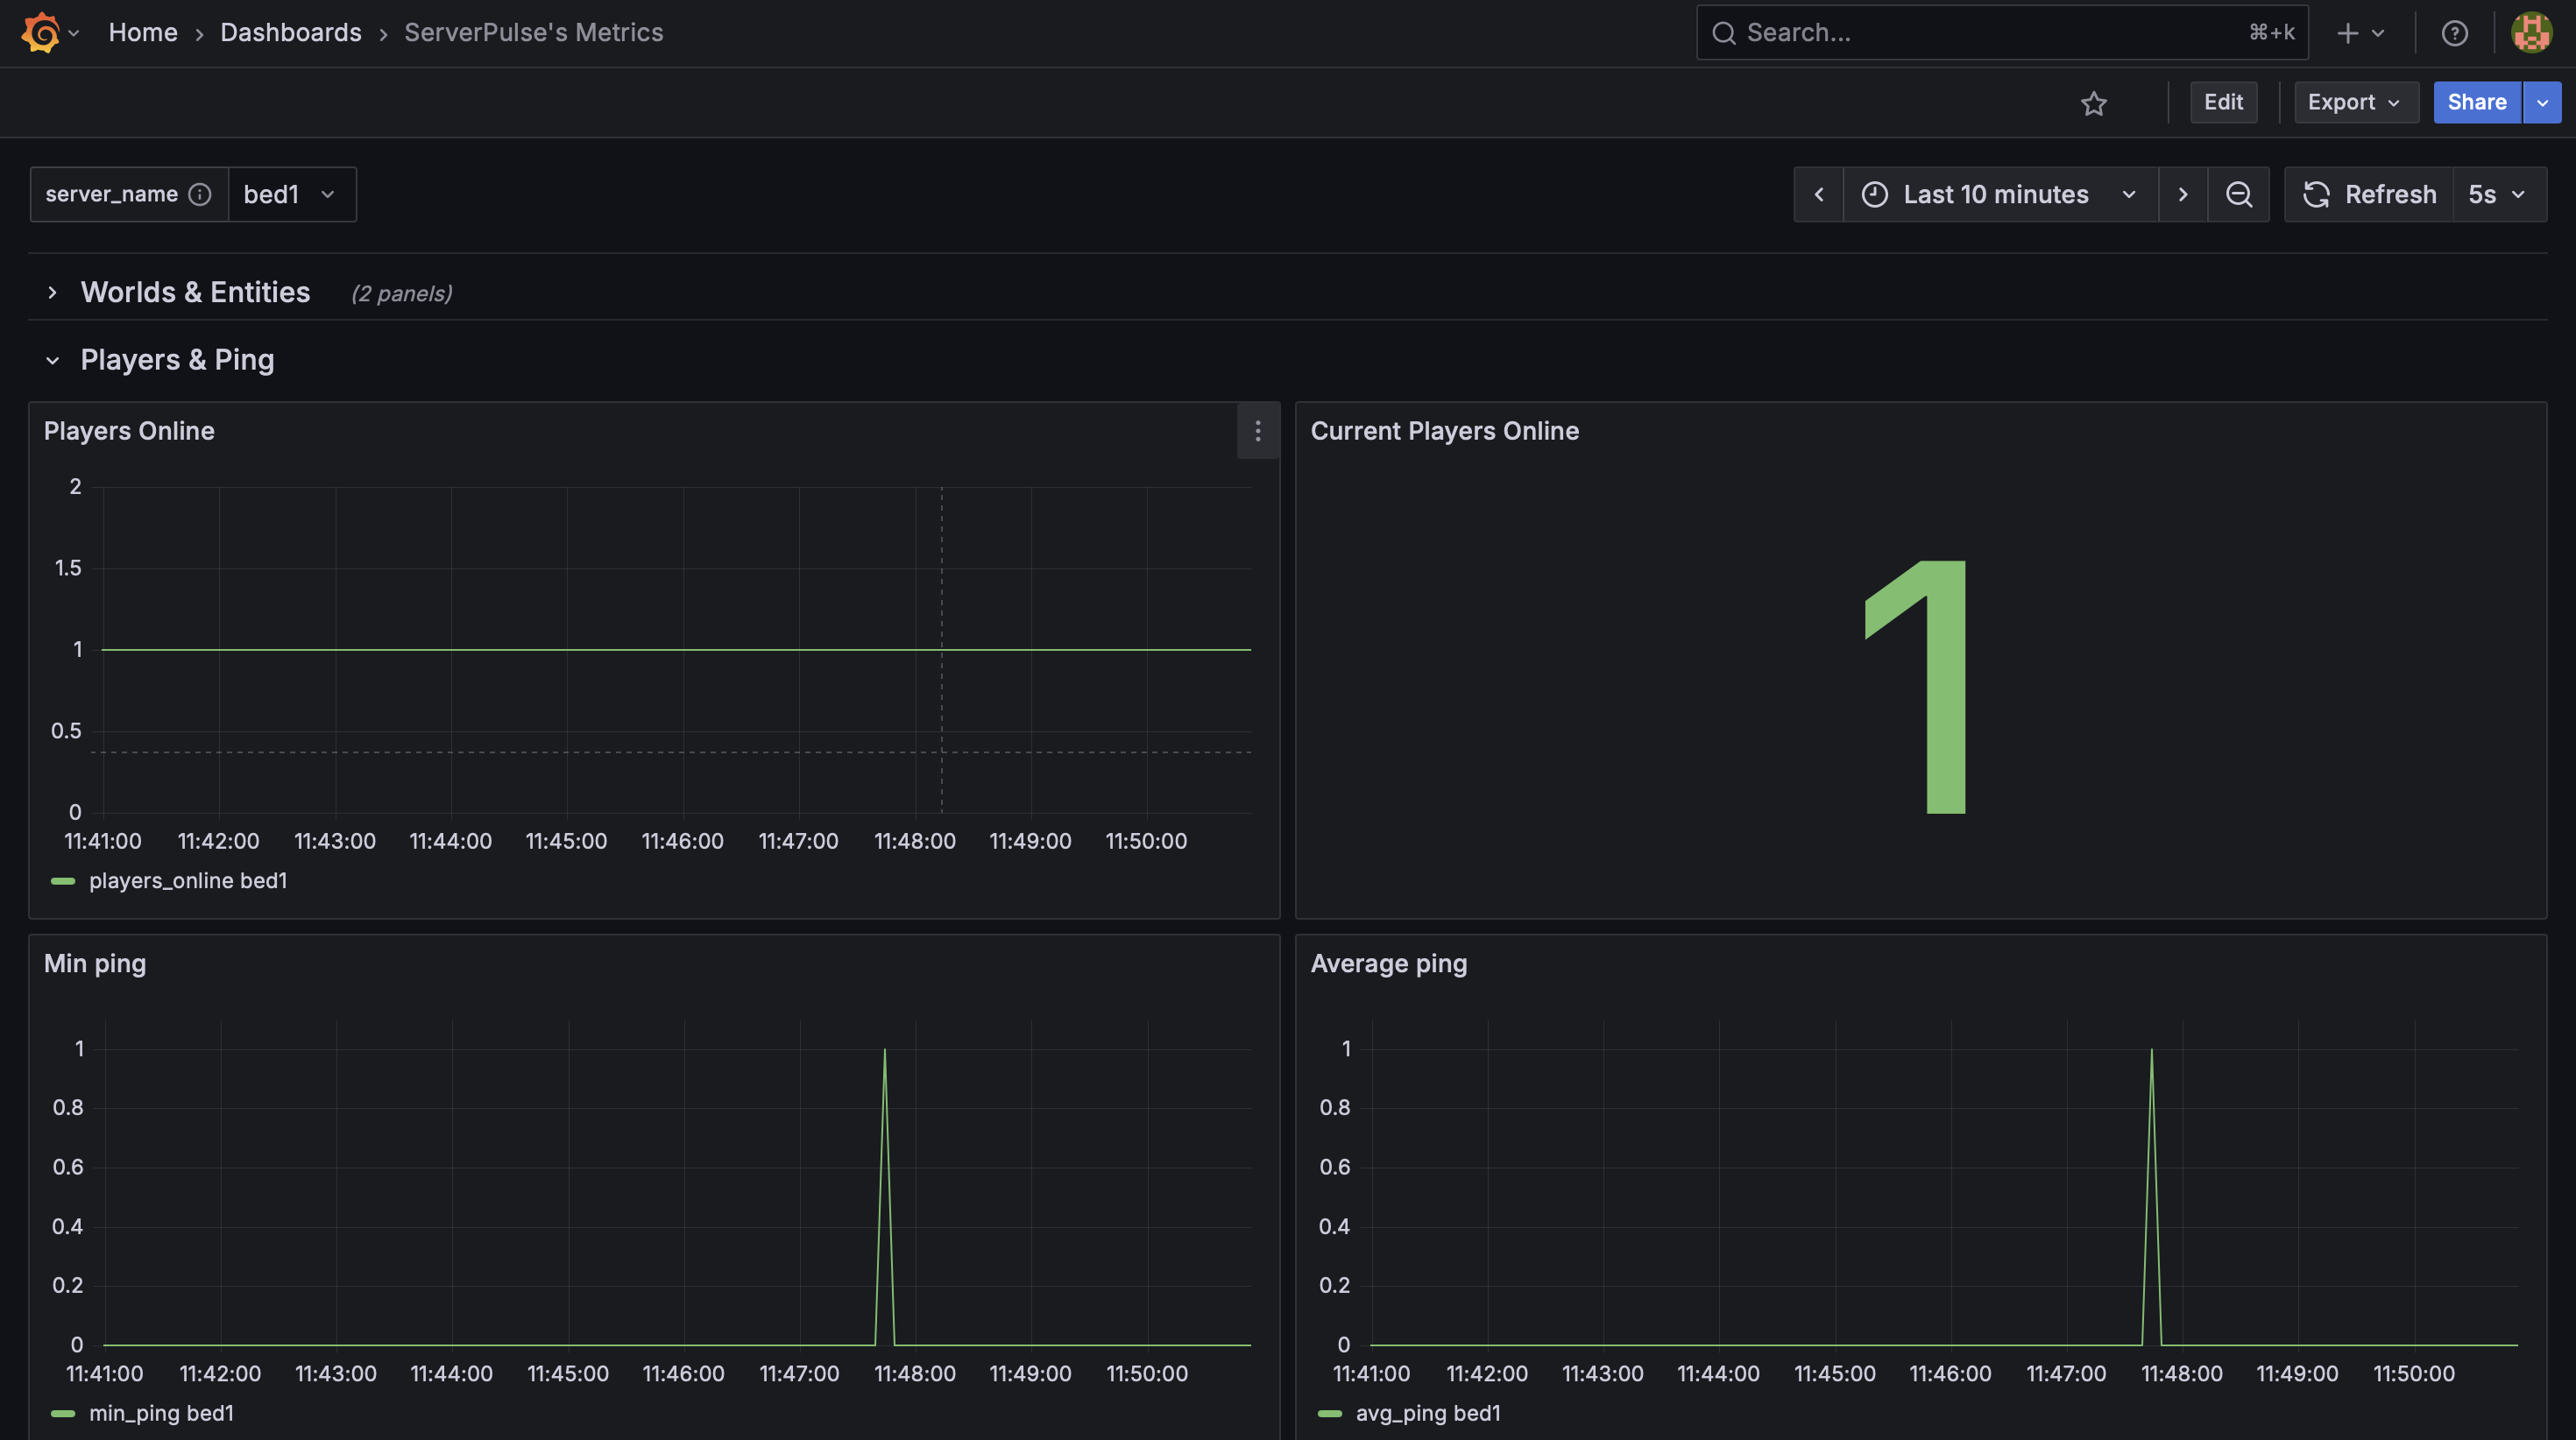
_Example dashboard view 4: Player Metrics_
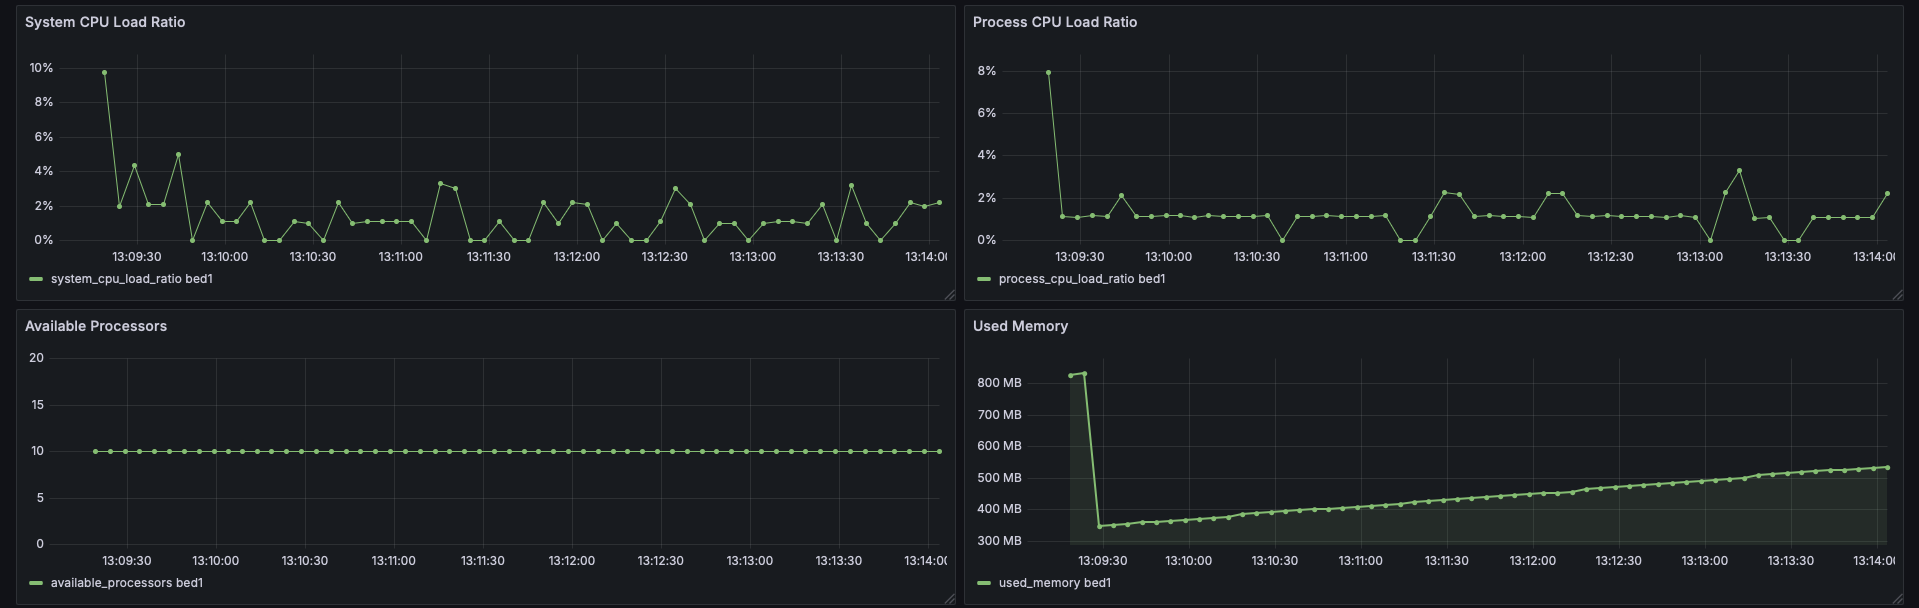
_Example dashboard view 5: CPU Stats_
Support & Contributions:
- Issues & Features https://github.com/renvins/serverpulse/issues
- Contributing https://github.com/renvins/serverpulse/blob/master/CONTRIBUTING.md
- Discord https://discord.gg/jZUqcemc4G
Ready to take control of your server’s performance with a professional monitoring solution? Download ServerPulse today!
常见问题
ServerPulse 支持哪些 Minecraft 版本?
ServerPulse 支持 Minecraft Java 版 1.21.4–1.21.10,共 4 个版本,可用的加载器:Bukkit / Fabric / Paper / Purpur / Spigot / Velocity。下载时注意选择和你游戏版本一致的文件。
ServerPulse 怎么安装?
先用 PCL2 或 HMCL 启动器安装对应版本的 Bukkit / Fabric / Paper / Purpur / Spigot / Velocity,再把下载的 .jar 文件放进游戏目录的 mods 文件夹,重新启动游戏即可。开启了版本隔离的,mods 文件夹在 versions/版本名 下面。运行环境:仅服务端。
评论
登录后评论和评分